Financial Wisdom Wave
  • Business
  • Stock
  • Politics
  • Tech News
Stock

Equities Remain in “Go” Trend as We See Rotation into Utilities

by October 22, 2024
October 22, 2024

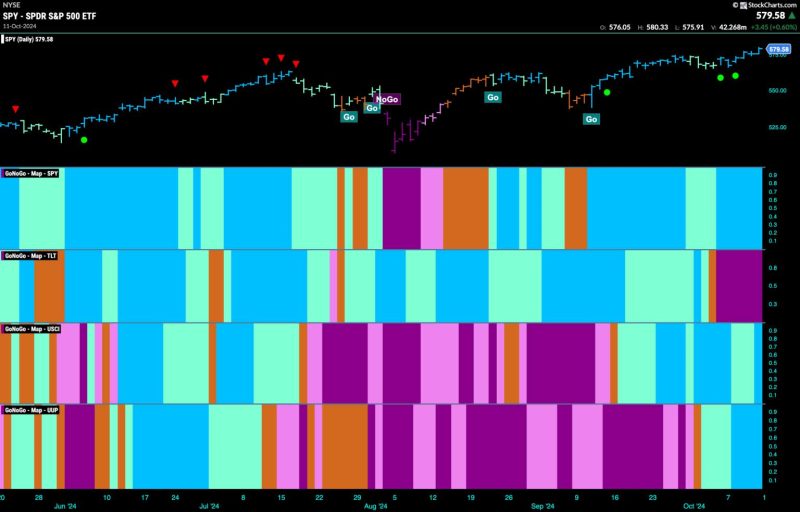
Good morning and welcome to this week’s Flight Path. Equities saw the “Go” trend continue this week as the indicator painted strong blue bars the entire week. Treasury bond prices saw the “NoGo” trend continue with a week of strong purple bars. U.S. commodities saw the “Go” trend continue this wek and at the end of the week we saw a new strong blue bar. GoNoGo Trend shows that trend in the U.S. dollar continued to be a “Go” with mostly strong blue bars.

$SPY Remains in “Go” Trend with Price at Highs

The GoNoGo chart below shows that the trend is strong for U.S. equities. GoNoGo Trend paints a week of uninterrupted strong blue bars as price remains elevated and close to highs. GoNoGo Oscillator has fallen from over bought levels and is now at a value of 3. This confirms the trend we see in the price panel.

The longer time frame chart tells us that the trend is still well and truly in place as we see another strong blue “Go” bar at new highs. GoNoGo Oscillator is approaching overbought territory and this represents enthusiasm from the market as we see prices climb higher.

The “Go” Trend Survives Another Week

Treasury bond yields emerged out of the “NoGo” last week and now we see that this week we have been able to maintain the new “Go” trend. The indicator paints strong blue bars and GoNoGo Oscillator is in positive territory at a value of 3.

The Dollar Continues to Show Strength

Last week we saw a Go Countertrend Correction Icon (red arrow) telling us that price may struggle to go higher in the short term. As is sometimes the case in strong trends, price blew right past this warning and we saw strong blue “Go” bars and new highs this week. GoNoGo Oscillator has remained elevated this week as it stays in overbought territory.
previous post
DP Trading Room: Which is Better? SP600 (IJR) or Russell 2000 (IWM)
next post
What’s the BEST Market Visualization Tool?

You may also like

Emerging Stocks to Watch – Breakouts, Momentum &...

May 17, 2025

S&P 500 Now in Weakest Seasonal Period…Or Is...

May 17, 2025

The Stock Market’s Comeback: Key Takeaways for Investors

May 17, 2025

SPY and QQQ Recapture their 200-day SMAs –...

May 17, 2025

Applying Dow Theory to Today’s Market: Are We...

May 17, 2025

What Sector Rotation Says About the Market Cycle...

May 16, 2025

SMCI Stock Rebounds: Why Its SCTR Score is...

May 15, 2025

The S&P 500 Snapped Back Hard: Now What?

May 15, 2025

How to Use Relative Strength in a Volatile...

May 15, 2025

Tariff Tensions Ease, Nasdaq Soars — But is...

May 14, 2025
Join The Exclusive Subscription Today And Get Premium Articles For Free

    Your information is secure and your privacy is protected. By opting in you agree to receive emails from us. Remember that you can opt-out any time, we hate spam too!

    Recent Posts

    • Boeing would avoid guilty plea, prosecution over 737 Max crashes in possible DOJ deal

      May 17, 2025
    • Emerging Stocks to Watch – Breakouts, Momentum & Upgrades!

      May 17, 2025
    • S&P 500 Now in Weakest Seasonal Period…Or Is It?

      May 17, 2025
    • The Stock Market’s Comeback: Key Takeaways for Investors

      May 17, 2025
    • SPY and QQQ Recapture their 200-day SMAs – Tips for Reducing Whipsaws and Improving Performance

      May 17, 2025
    • About us
    • Contact us
    • Privacy Policy
    • Terms & Conditions

    Copyright © 2024 FinancialWisdomWave.com All Rights Reserved.

    Financial Wisdom Wave
    • Business
    • Stock
    • Politics
    • Tech News