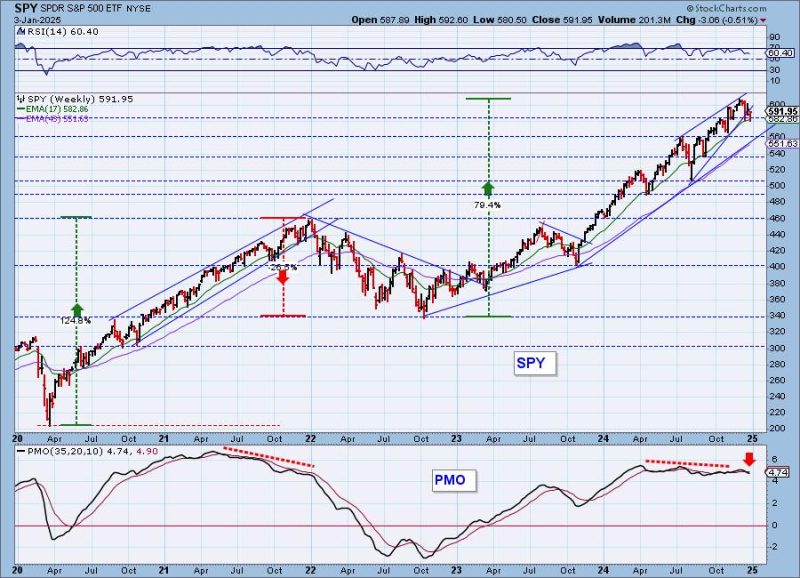
We monitor the weekly SPY chart and present it to our subscribers every Friday in our DP Weekly Wrap. We have been watching a bearish rising wedge on the weekly chart. The rising wedge pattern implies that you will get a breakdown from the rising bottoms trendline. That is exactly what happened this week.
The one problem with these patterns is that they don’t give us a minimum downside target as most chart patterns provide. For me, my back of the napkin calculation is to look at the beginning of the pattern and determine the height. That is at around 60 points (500 + 60 = height of the back of the pattern). That would imply a drop of the same amount from the breakdown point. It happened just under 600 so I would say the downside target of the pattern would be to 540 which is a strong area of support.
The weekly PMO has topped and given us a new Crossover SELL Signal as of last Friday. We will say that the weekly PMO is flat above the zero line and that typically implies pure strength in a move, however this Crossover SELL Signal is an attention flag. We can also see that the PMO carries a negative divergence with price tops.
One thing that could save the SPY from a deep decline to 540 is the rising trend channel. Price may only need to test the bottom of the channel and not necessarily see a breakdown from there.
Conclusion: The market is long overdue for a correction if not a bear market. The breakdown on the weekly chart and the new weekly PMO Crossover SELL Signal are attention flags that the correction may be upon us. It’s probably a good idea to make sure your positions have listed stops as even a drop to the rising bottoms trendline would be problematic.
The DP Alert: Your First Stop to a Great Trade!
Before you trade any stock or ETF, you need to know the trend and condition of the market. The DP Alert gives you all you need to know with an executive summary of the market’s current trend and condition. It not only covers the market! We look at Bitcoin, Yields, Bonds, Gold, the Dollar, Gold Miners and Crude Oil! Only $50/month! Or, use our free trial to try it out for two weeks using coupon code: DPTRIAL2. Click HERE to subscribe NOW!
Learn more about DecisionPoint.com:
Watch the latest episode of the DecisionPointTrading Room on DP’s YouTube channel here!
Try us out for two weeks with a trial subscription!
Use coupon code: DPTRIAL2 Subscribe HERE!
Technical Analysis is a windsock, not a crystal ball. –Carl Swenlin
(c) Copyright 2025 DecisionPoint.com
Disclaimer: This blog is for educational purposes only and should not be construed as financial advice. The ideas and strategies should never be used without first assessing your own personal and financial situation, or without consulting a financial professional. Any opinions expressed herein are solely those of the author, and do not in any way represent the views or opinions of any other person or entity.
DecisionPoint is not a registered investment advisor. Investment and trading decisions are solely your responsibility. DecisionPoint newsletters, blogs or website materials should NOT be interpreted as a recommendation or solicitation to buy or sell any security or to take any specific action.
Helpful DecisionPoint Links:
Price Momentum Oscillator (PMO)