I have been traveling in the US since 1/15 and attended the CMTA Mid-Winter retreat in Tampa, FL 1/16-1/17 and then moved to Redmond, WA to work from the StockCharts.com office this week. Unfortunately, the 40-degree (F) temp drop between Tampa and Seattle left me with a cold and a sore throat so I am skipping this week’s video.
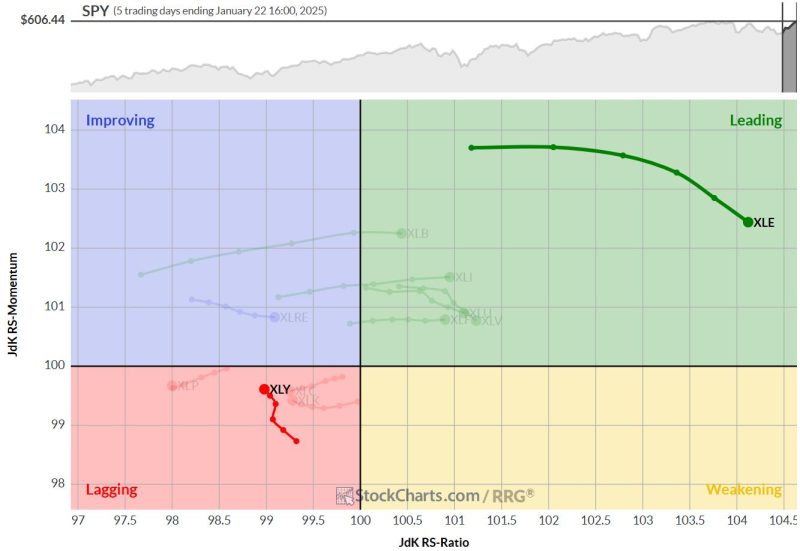
On this daily RRG, I have highlighted the tails for XLE and XLY.
In my “best five sectors” series, XLE entered the top five this week, replacing XLK. which was pushed down to position 6. Consumer Discretionary still remains the no 1 sector. The daily tail for XLE really stands out in terms of length and having both the highest RS-Ratio and highest RS-Momentum readings in the universe.
XLY rotated through lagging and has recently started to pick up again. The reason why XLY still remains the strongest sector can be seen on the weekly RRG below.
On this time frame, XLY is deep inside the leading quadrant and rolling over as it is losing RS-Momentum. So far, the loss of relative strength (RS-ratio) remains limited.
The XLE tail is another story, the rotation here suggests weakness as it is rotating back into the lagging quadrant. The strength on the daily for XLE and the weakness for XLK have caused them to switch positions. So far, that has not been very beneficial, but time will tell.
In any case, while the sector is now one of the best five, we may as well take a look at the individual stocks and see if there are any interesting charts to be found.
Energy – XLE
The RRG (weekly) for Energy stocks shows an evenly spread universe with a bit more tails at higher RS-Ratio levels. While checking the price charts of symbols showing strong RRG characteristics a few came out as potentially interesting.
EQT Corp – EQT
EQT is well inside the leading quadrant and recently started rolling over. However, the upward break in the price chart opened up a lot of upside potential.
A drop back towards or into the support zone between 48-50 would be an ideal time to look for buying opportunities, if we get there. Any newly formed higher low will confirm the strength of the current move.
Coterra Energy – CTRA
CTRA is somewhat similar. Here also a nice upward break out of a long sideways range which is holding up well. Any setback into the former resistance area, now support, should be seen as a renewed entry opportunity.
CTRA still has some resistance waiting around 32, the level of the 2022 peak.
Baker Hughes – BKR
From the cluster of symbols on leading or weakening around 100 on the RS-Momentum scale, BKR shows a promising chart.
The recent break above its previous high is holding up well while relative strength remains strong. The current (mild) loss of relative momentum seems temporary.
EOG Resources – EOG
EOG is located close to the benchmark with a very short tail and it has just crossed back into the leading quadrant. The upward break in the raw-RS line suggests that there is more relative upside underway.
On the price chart, there is serious overhead resistance just below 140 where several highs have lined up over the past three years. But the in-between-lows during that same period are all higher. This builds a very large ascending triangle, which is generally a bullish pattern. The trigger will be the upward break above that horizontal barrier.
The long-term implications show up even better on the monthly chart for EOG.
Once that upper boundary is taken out, EOG will have some serious upside potential.
#StayAlert, –Julius
